Redefining Disadvantaged Communities
May 8, 2019

Daly City. Photo by Daniel Hoherd, Flickr Creative Commons
Deidre Sanders, PhD
Director of Government and Community Affairs
California is a highly diverse state, with some of the wealthiest communities in the country. At the same time, California also has the highest level of poverty in the nation, according to the California Budget and Policy Center.
This disparity has helped feed a misperception that community choice energy (CCE) programs serve only affluent customers in coastal communities, rather than the diverse households and communities that make up California.
In fact, the areas CCEs serve are reflective of the range found in the whole state. The problem comes from looking just at income levels, rather than the cost of living. While incomes may be higher in some CCE areas, so too are housing and other expenses.
Moreover, while California’s social programs can help low-income households throughout the state, actual living standards of moderate-income households in more expensive areas may appear indistinguishable from those of low-income households in less expensive areas.
As policymakers seek to support California’s impoverished residents, they should look to the California Poverty Measure (CPM), developed by the Stanford Center on Poverty and Inequality (CPI) and the Public Policy Institute of California (PPIC).
The CPM takes into account living expenses and low-income program benefits, in addition to income. It reveals that actual poverty in comparatively more affluent areas is higher than census data indicates.
A TALE OF TWO CITIES
To show this effect, we can compare Daly City, just south of San Francisco in San Mateo County, with Fresno, in the Central Valley. San Mateo County is served by Peninsula Clean Energy, while Fresno does not have a CCE provider yet.
The statewide estimated median income for a family of four in 2018 was $67,169. County income levels in San Mateo County were more than twice that of Fresno County, $105,667 versus $48,730.
But this is only income levels – it doesn’t reflect the cost of living or variation within the county.
The median Daly City family makes about $86,000 per year, but may spend $3000 a month on average for a two-bedroom apartment, or 42 percent of their gross income – well over half of their take-home pay. Meanwhile, a city of Fresno family earning $45,000 per year may spend $1000 per month for a similar apartment, or 27 percent of their gross income.
Applying the California Poverty Measure, to adjust for the cost of living and additional income from social programs, the actual percentage of people living in poverty in these communities is 17 percent for San Mateo County and 20 percent for Fresno County, even though median San Mateo incomes are almost twice as high. Using the official federal poverty measurement, only 8 percent of San Mateo County residents live in poverty compared to 26 percent in Fresno County. As the CPM reveals, the poverty levels are actually much closer.
The story is largely the same with other CCEs. East Bay Community Energy, serving Alameda County, has census tracts with median household incomes ranging from $230,000 to $16,500. MCE Clean Energy, founded in relatively affluent Marin County, now serves large parts of Contra Costa County. Their census tract household incomes range from $250,000 in Tiburon to $25,000 in Richmond.
A MORE PERVASIVE PROBLEM
While the misperception of CCE customers is a concern, there are bigger problems with how we define poverty in California, with real implications for financially struggling families.
Many state policies and programs define “disadvantaged communities” and households based solely on income levels, rather than also considering living costs. California’s vast differences in income and cost of living means that state programs do not consider some people who need their help.
Some of these policies directly affect CCE customers. California has made an extraordinary effort to ensure that disadvantaged communities benefit from actions to promote clean energy and fight climate change. Numerous policies and programs direct funds toward such communities, helping clean up polluted neighborhoods and create local jobs.
The most notable policy is the California Climate Investment Fund created by AB 32, which directs cap and trade revenues to a wide variety of climate issues. The program has funded $8 billion of projects since 2013.
At least 35 percent of these investments are made in disadvantaged and low-income communities, identified in part by the California Environmental Justice Screening Tool, known as CalEnviroScreen.
CalEnviroScreen ranks communities based on environmental features and exposures, combined with demographic data. This is very important in remedying the unequal environmental burdens that low-income communities may endure. Still, the tool measures poverty based simply on the Federal Poverty Level, a single nationwide value. So while “Housing Burden” is a factor, it is unclear to what degree it is weighted to influence “Poverty.” Moreover, very low-income communities may score low in the ranking if they do not have comparatively high environmental burdens or features.
Looking again at Fresno and Daly City, we see that much of Fresno ranks in the top 10 percent of CalEnviroScreen scores. Daly City is farther down, closer to the 50th percentile.
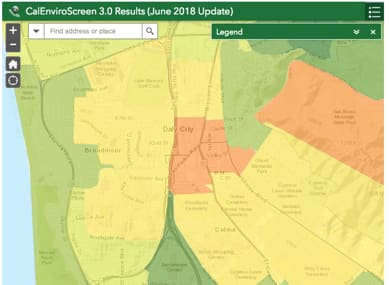
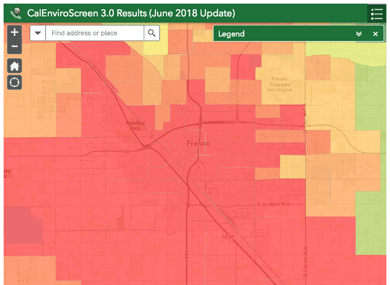
CalEnviroScreen Scores for Fresno (left) and Daly City (right). Source: Office of Environmental Health Hazard Assessment (OEHHA).
An additional problem with CalEnviroScreen is that it identifies environmentally impacted disadvantaged communities, rather than disadvantaged communities in general. This means that programs designed to address socioeconomic disadvantage may be directed to communities that have comparatively more environmental concerns and less socioeconomic disadvantage (e.g., “poverty”). This can occur both in comparatively more impoverished Central Valley and Coastal communities when ranked with communities with significant environmental burdens.
And within identified environmental impacts, CalEnviroScreen rankings do not explain why communities are priorities. Communities that score high due to pesticide use, for example, may be prioritized for electric vehicle chargers, creating a mismatch between community needs and remedies.
NEW MEASURES NEEDED TO SERVE ALL OUR COMMUNITIES
For our efforts to succeed in California’s diverse population and landscape, we need a better approach based on more accurate perceptions of what it means to live in poverty. In sum, there are two problems with how we define disadvantaged communities, both in perception and in program designs.
First, income is not the sole predictor of poverty due to high living costs in urban/coastal/resort areas. Second, income disparity can be masked in areas that have comfortable median incomes. As a result there are households truly living in poverty that cannot benefit from programs intended to help them because they do not fit the operating definitions of “poverty.”
Redefining how we identify disadvantaged communities and households will not only help us better serve all those struggling financially, but it will also help us develop better strategies to slow and reduce displacement of those living in poverty or near poverty from high cost regions. CCEs are looking to new tools to help us equitably serve all our communities. We are also looking to partner with other entities in the state to help us do so.
Deidre Sanders is Director of Government and Community Affairs for East Bay Community Energy.