Data Corner: Getting To Know Our Customers, Statistically
October 8, 2019
EBCE is using data analysis to better understand and serve the needs of our customers.

Photo by NASA
EBCE is stepping up its big data game, to better understand and serve the needs of our customers. We are now digging into residential load data as a first step in better focusing energy efficiency efforts.
EBCE has invested in a powerful database that enables administrators and implementers of energy efficiency, demand response, and energy management programs to access information that increases building upgrades in Alameda County. This data is also valuable to EBCE’s local government partners who are developing greenhouse gas inventories.
Kevin Li of the EBCE technology and analytics team is putting the data to work comparing hourly residential demand against hourly weather to identify and understand customers that are likely to have air conditioning or electric space heating. These “weather responsive” customers use more electricity overall and see much higher periods of peak demand.
Thanks to the East Bay hills, EBCE’s service territory covers two distinct climate zones: the temperate bayside cities around Oakland, and the warmer inland cities of Dublin and Livermore, where air conditioning is common.
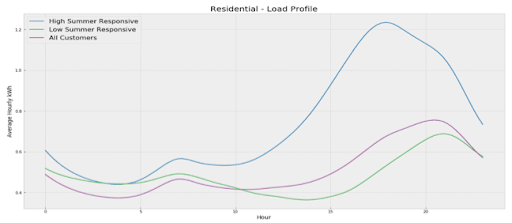
Sure enough, summertime data shows that household electricity demand in Livermore and Dublin correlates closely with high temperatures, while every other jurisdiction — west of the hills — has fairly average consumption. Weather responsive customers on average use 1.7 times as much electricity in the summer as non-responsive customers.
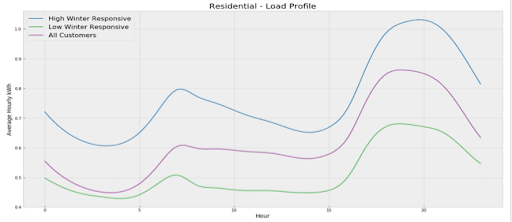
Livermore and Dublin customers are also the most responsive to winter temperatures, while Piedmont and unincorporated Alameda County are the least responsive. These winter-responsive customers use 40-50 percent more power than others, implying they rely more on electric heat, which fluctuates with temperature.
As shown in the charts below, weather-responsive customers also see much higher evening demand peaks. This can drive up bills for customers on time-of-use rates, which are highest in summer afternoons and early evenings. It also increases EBCE’s need to buy Resource Adequacy services and more expensive evening electricity, which raises costs for all customers.
Residential Load Profiles for Winter (top) and Summer (bottom)


While weather is a major driver of residential electricity demand, other factors are also at play. Piedmont and Livermore had the highest average daily consumption (kWh) per customer, while Berkeley and Emeryville had the lowest, both in the winter and in the summer. Piedmont, on the west slope of the hills, has mild weather but larger homes.
To better refine our analysis, we’ll be pairing demand with publicly available demographic and housing data, such as parcel data, the distribution of winter/summer sensitive customers among census tracts of varying poverty levels, and average bill amounts between weather sensitive and non-sensitive customers.
By getting to know our customers — statistically — we can make energy efficiency programs more accurate, more cost effective, and more equitable, lowering costs for all.