Understanding Rates
Jun 3, 2024
The rising threat of wildfires has pushed PG&E to invest billions in their grid, driving up electricity rates to unprecedented levels. We go deep to understand how rates are set, how Ava rates relate to PG&E decisions, and what the future may hold.
PG&E has grabbed headlines in recent months for the huge rate increases that they claim are needed to pay for safety improvements to their system.
Those increases are affecting Ava customers, who pay Ava for electricity and pay PG&E to have it delivered. Ava customers pay twice as much to PG&E to have power delivered than they do for the electricity itself. Ava’s own charges have risen only a little, even as we expand our portfolio of clean energy and ramp up our local programs. But overall bills for Ava customers are rising, in large part due to higher PG&E charges.
To understand what’s going on, we have to go under the hood to see how rates are designed, how expenses are allocated, and what is driving rate increases.
What’s up? Rates!
In November the California Public Utilities Commission (CPUC) authorized a 10.7% increase in revenues for PG&E over the previous year, one of the largest rate increases in the company’s history, and marking PG&E as the “most expensive power provider” in the state, surpassing San Diego Gas & Electric.
In early March, regulators approved another increase, raising bills another $5 per month for the average household.
At a March 6 hearing of the Assembly Utilities & Energy Committee, Linda Serizawa, deputy director of the CPUC’s Public Advocate Office, said PG&E rates have risen 127% since 2014, well above the 30% rate of inflation.
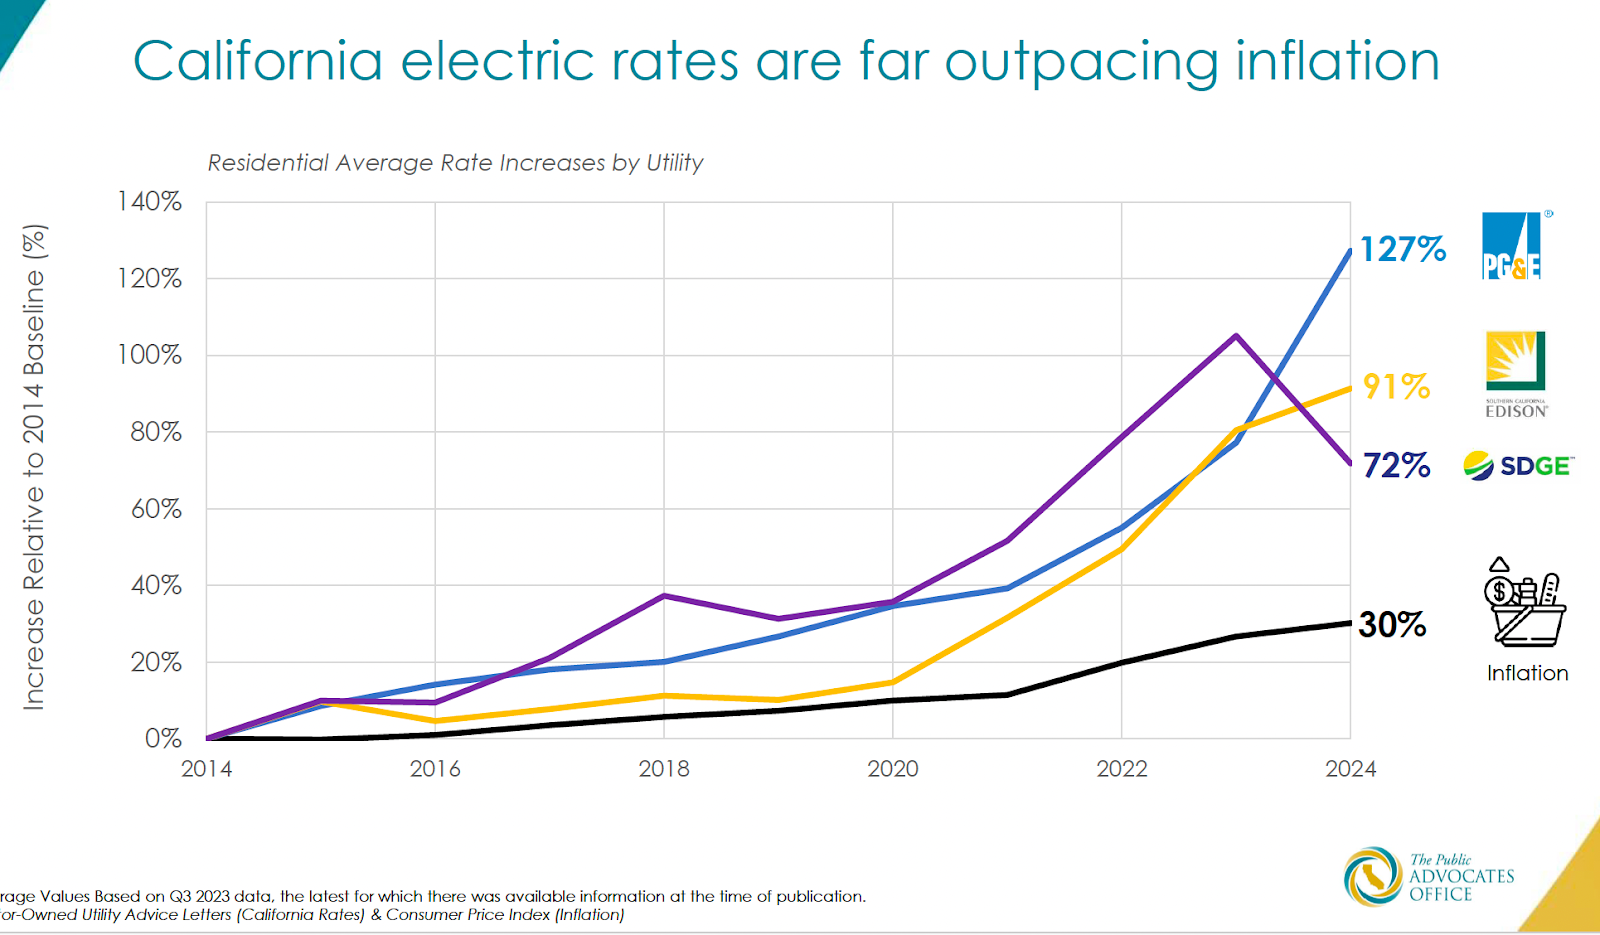
Source: CPUC Public Advocates Office
California has some of the highest electricity rates in the country, though this is tempered by the fact that California households consume less energy than average US homes — due to mild climates and years of policy in support of energy efficient homes — resulting in only average bills.
Still, high rates increase the energy burden for low-income households, can drive away energy-intensive businesses, and are an impediment to electrification, where customers replace polluting natural gas and gasoline with clean electricity to cut carbon emissions.
Why are rates rising so much? And what is Ava’s role in the cost of electricity?
Drivers of rate increases
In her presentation, Serizawa also pointed out that the chief drivers of higher rates statewide are transmission and distribution (T&D) costs. While California generation costs rose a half-cent from 2020 to 2023, T&D costs rose 5.9¢ per kilowatt-hour (kWh). Public purpose programs doubled, adding another 1.1¢.
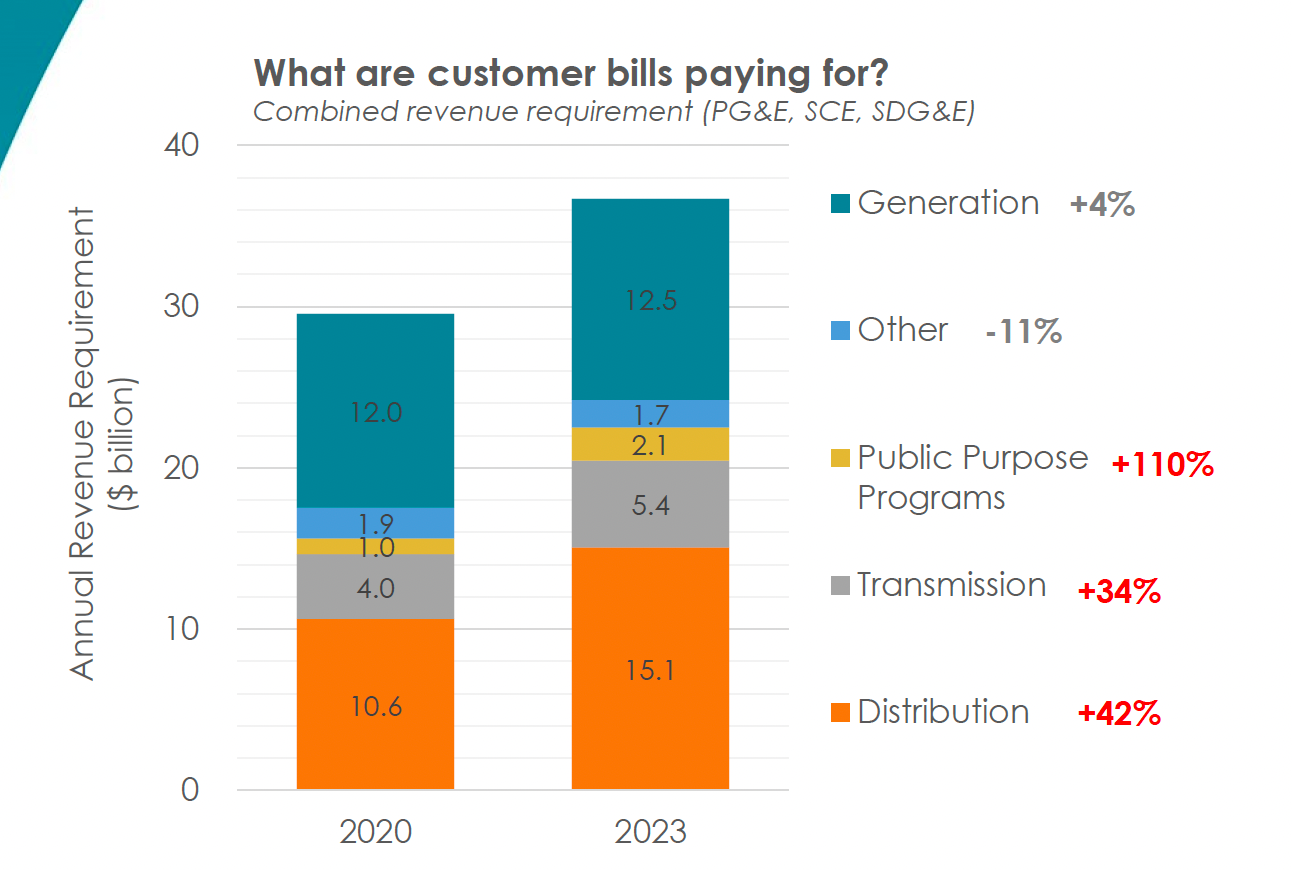
Source: CPUC Public Advocates Office
Every four years, the CPUC undergoes a “general rate case” for the state’s three investor owned utilities (IOUs). A rate case is a comprehensive accounting and forecasting process that adjusts rates to cover the expenses the utility faces in serving customers. In simplest terms, all the cost estimates are added up to a “revenue requirement,” which is then spread over the expected number of kilowatt-hours sold.
This results in a rate, measured in cents per kilowatt-hour (¢/kWh). Rates are then varied by customer class, time of day and season, level of consumption, and other variables, resulting in dozens of rate options, or tariffs.
In the current rate case, PG&E was allowed to increase rates approximately 12.8% in 2024, 1.6% in 2025, and a slight decrease of 2.8% in 2026. For an average residential customer getting full service from PG&E, this translates to bill increases of $32.50 this year and $4.50 in 2025, and a decrease of almost $8.00 in 2026.
PG&E estimates that more than 85% of the increase in the current GRC will be used to “reduce risk” in their operations. This means putting 1,230 miles of power lines underground in high fire risk areas, expanding tree trimming operations, deploying better grid monitoring and controls, and replacing and repairing over 150 miles of gas pipelines. Additional costs will go into upgrading electric distribution systems to support electric vehicle charging.
Altogether, wildfire-related expenses accounted for almost a quarter of total revenue requirements for PG&E in 2022, as shown in the pie chart.
PG&E 2022 Year-End Total System Revenue Requirement by Rate Component with Additional Wildfire-Related Revenue Requirement Breakout
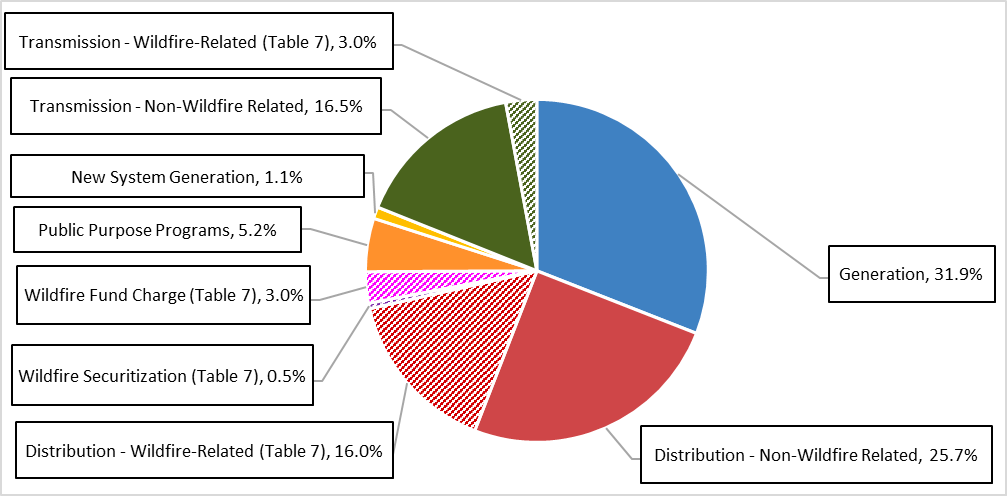
Source: CPUC report to legislature, 2023
Excess profits can also contribute to high rates. Since utilities are monopolies regulated by the CPUC, their level of profit is part of their revenue requirement, which is estimated in advance. But a utility may have higher revenue or lower expenses than predicted, resulting in a higher profit. A review by the California State Auditor found that San Diego Gas & Electric earned more than their CPUC-authorized profit in nine out of the last ten years.
Cost adjustments can also happen in between rate cases, through “riders” for specific unanticipated expenses. The Auditor’s report found that operating expenses increased between 5% and 37% between the two most recently approved general rate cases.
One of these riders followed fast on the heels of PG&E’s most recent rate case, as they requested funds in January to pay for billions of dollars in spending on vegetation management and emergency response from 2020 to 2022. That increase was approved in March, adding another $5 a month for the average residential customer.
Costs On Top of Costs
California electricity customers also pay for expenses that are not in rates, but tacked on as extra fees. These too mostly cover wildfire costs.
The Wildfire Hardening Charge pays for $1.4 billion in bonds that PG&E has issued to cover the cost of reducing the risk of fires from their power lines. Likewise, the Recovery Bond Charge pays for “certain costs related to catastrophic wildfires,” adding another 0.5¢ per kilowatt-hour on average.
A separate Wildfire Fund Charge collects about $1 billion per year from all California utility customers to fund the California Wildfire Fund of the state Department of Water Resources. That fund is used to reimburse customer claims arising from wildfires caused by a utility company.
The Wildfire Fund Charge took the place of a charge of a similar amount that Californians have been paying to cover the costs related to the 2001 energy crisis. To mitigate the crisis at the time, the state signed 58 long-term power contracts at an estimated total cost of over $40 billion. They later sold $11.2 billion in bonds to spread out payments until 2020. When that debt was paid off, the fee continued in order to cover wildfire costs.
Customers of Ava and other CCAs also pay the Power Cost Indifference Adjustment (PCIA) for the “above market costs for electric generation resources that were procured by PG&E on their behalf,” even after leaving PG&E service. PCIA costs are calculated every year by the CPUC, varying according to market conditions. Ava customers paid almost $280 million in 2021, or 4.3¢ per kilowatt-hour. But that number fell to only $12.6 million in 2023, or 0.2¢ per kWh.
Lastly, Ava customers support “public purpose” programs, such as for energy efficiency and research, for both gas and electric consumption.
Embedded Costs
These “extra” charges are small compared to the expenses that are simply rolled into rates, making them harder to identify.
The largest of these embedded costs are the rate discount programs for low-income customers. The California Alternate Rates for Energy (CARE) program provides bill discounts of 20% or more for income-eligible customers. PG&E’s CARE budget in 2022 was $996,478,354 in total, part of $2.4 billion statewide, all paid for by ratepayers. About 1.5 million PG&E participating households received average monthly bill discounts of approximately $52 for electric bills and $14 for gas.
The Family Electric Rate Assistance (FERA), a similar discount program, served 35,000 PG&E families with electric bill discounts averaging $38 per month, for a total program cost of $20 million in 2022.
PG&E’s Energy Saving Assistance (ESA) program, which provided energy efficiency upgrades for over 67,000 low-income PG&E customers in 2022, is budgeted at $972 million over five years.
These three energy assistance programs work out to over $1.2 billion per year collected from customers in the PG&E territory, including Ava customers.
Ava’s Role in Rates
As mentioned before, Ava’s primary role is to procure electricity on behalf of its customers, while PG&E continues to manage delivery. Delivery costs have long been greater than generation, and are rising faster now.
Utilities were forced to (or chose to) sell off most of their power plants in the late 1990s, during the transition from regulated to competitive power markets. PG&E still owns some hydroelectric dams, natural gas and solar plants, and the Diablo Canyon nuclear plant.
Most of Ava’s contracted power comes from independent generation companies like Clearway and Pattern. Ava also buys power from short-term markets to fill in the gaps around the long-term contracts, and other services that ensure reliable supply, such as resource adequacy.
Ava’s generation costs are indeed rising, driven by inflation, supply disruptions caused by the pandemic, booming demand for renewable energy, and a dynamic global market for equipment. While solar power is the cheapest form of new generation, new projects in California need to come with batteries, since daytime power generation is getting saturated by abundant solar power. Batteries add capabilities and value, but also cost more.
Ava’s rates are set by the board, who are elected officials from member jurisdictions. Because the board has tied Ava’s rates to PG&E rates– but with a discount — Ava rates are also getting pulled up as PG&E rates rise.
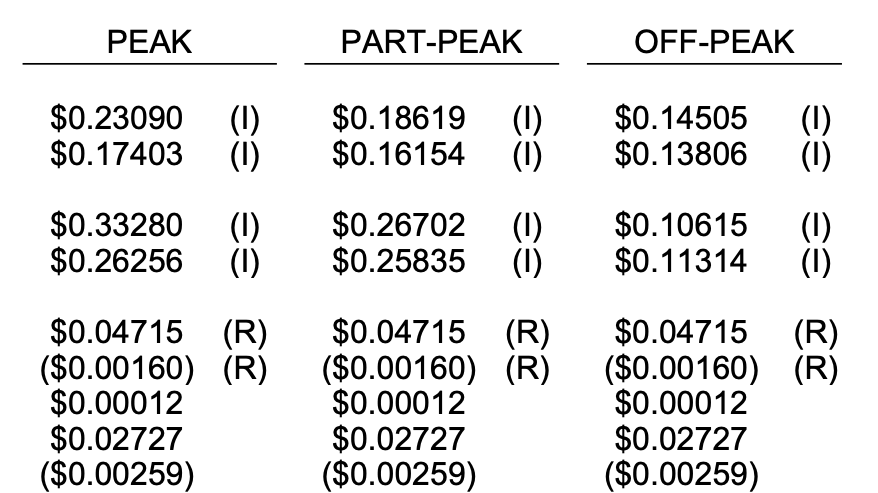
Following PG&E’s rate increase, Ava rates rose 19% in January, with generation costs rising 2.5¢ per kilowatt-hour on average. PG&E’s delivery rates, as shown in the chart, rose by 35% to 27.6¢ per kWh.
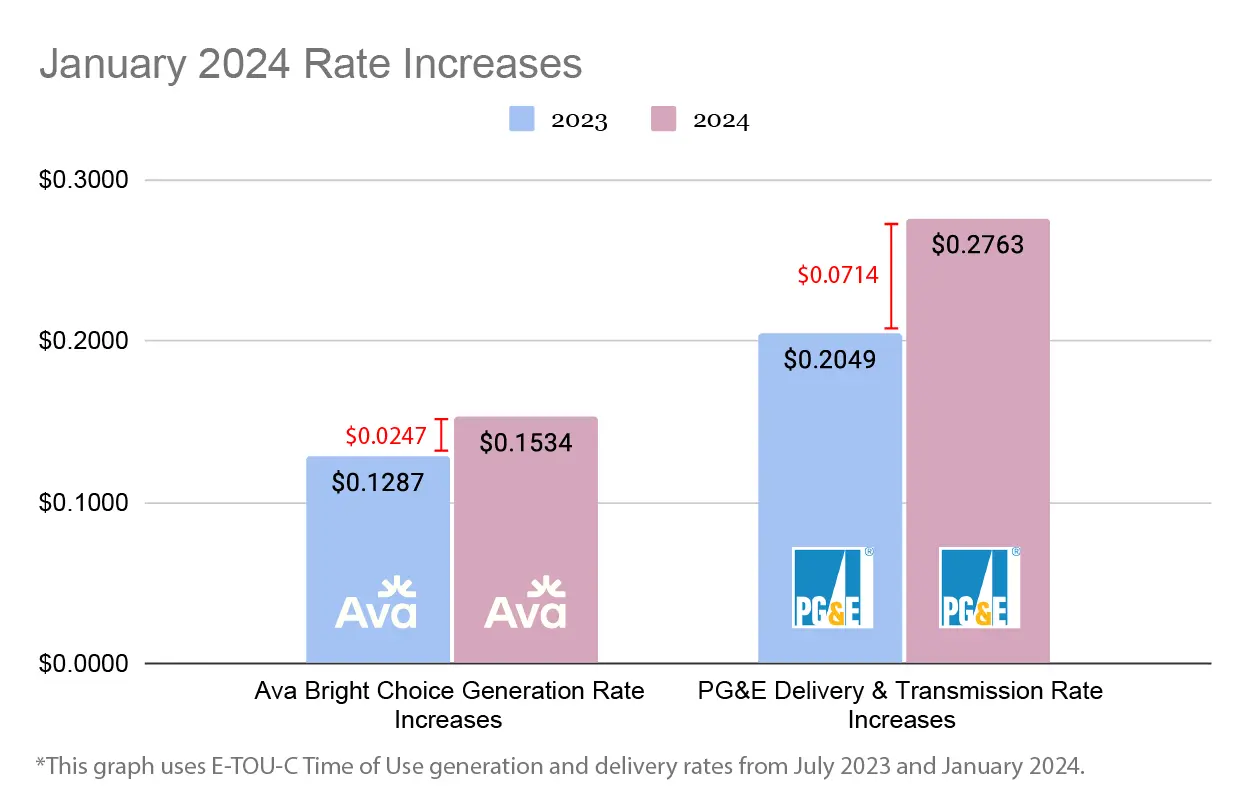
Because PG&E expenses are rising faster than Ava’s, Ava has been generating budget surpluses. Ava is of course a non-profit, so no money goes to shareholder dividends. Instead it goes back to customers, or is used to expand financial reserves, or to buy more renewable energy, or to increase funding for local programs. In fact, Ava has saved its customers over $100 million through low rates and bill credits.
In December 2023, the Ava board voted to return $16 million to customers, including a one-time $50 bill credit to 115,000 residential customers on rate discount programs. The board has made plans for an expected 2024 surplus, which could offset more than half the cost of PG&E’s rate increases. Additional funds could support local rooftop solar and storage projects that benefit low-income households and communities.
Consequences
Rising electricity costs are creating consequences for California beyond household budgets. The move to cut global warming pollution hinges on converting homes and businesses from natural gas to electricity for space heating and water heating, and converting gasoline cars to electric. But as electricity rates rise, going all-electric becomes less financially attractive.
One strategy to address this is to collect more revenues from fixed bill charges and less from each kilowatt-hour sold, and link the size of the fixed charge to household income. The legislature asked the CPUC to design an “income graduated fixed charge.” While utilities had proposed very large fixed charges — as high as $129 a month for customers in San Diego — the Commission on May 9 approved fixed charges of $6 per month for CARE customers, $12 for FERA customers, and $24.15 for everyone else. The decision would cut electricity delivery rates by 5-7¢ per kilowatt-hour.
Again, these changes would only apply to the PG&E portion of the bill, but would be paid by Ava customers. They will fall disproportionately on households in mild climates that have low energy consumption — such as many Bay Area Ava customers. An Ava staff analysis found that 77% of Ava customers would pay more under the CPUC plan, including 55% of CARE customers.
Still, the higher cost on Ava customers is more modest than under the plan proposed by PG&E, as shown in the figure.
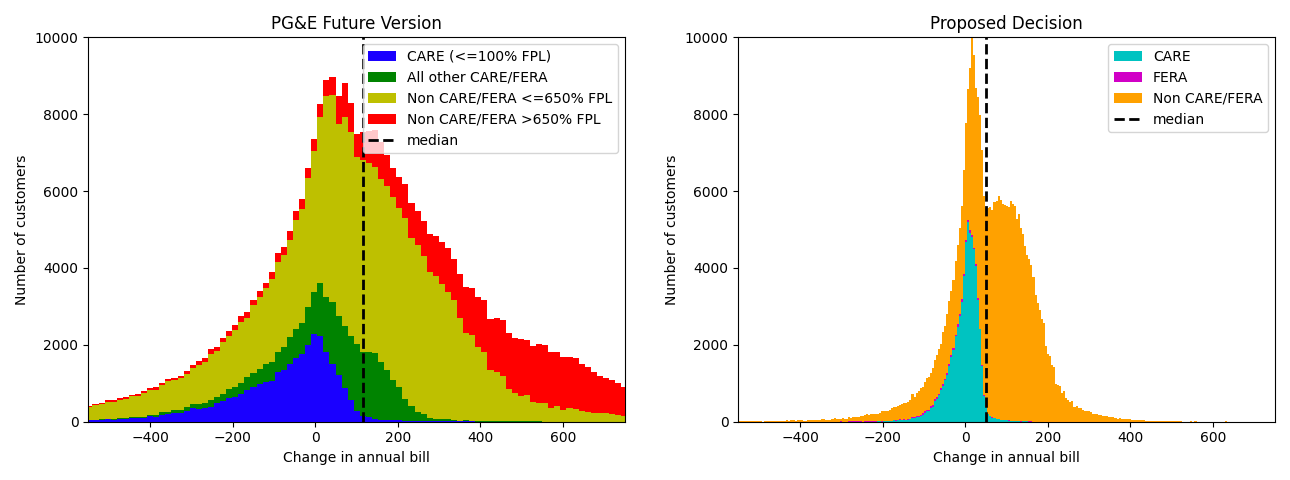
The PG&E proposal (left) would have had extremely high annual cost impacts, especially for customers not in the CARE program. The CPUC decision (right) has much smaller amounts, but most Ava customers would still pay more.
Source: Ava staff analysis
Forecast for the future
Are rates going to rise forever? What could reverse the trend?
In a report to the legislature, the CPUC warned that further cost increases are on the way. “Wildfire risk mitigation costs are projected to continue their upward trend” in coming years, they wrote, adding to “previous costs incurred but not yet authorized for recovery.”
They reported that the three large electric IOUs spent $20.7 billion on wildfire mitigation in the 2020-2022 cycle, and plan to spend another $26.2 billion for the 2023-2025 cycle.
“The order of magnitude of these costs shows the scale of the problem that California is facing: climate change is escalating, with stronger storms, hotter temperatures, and conditions that increase the risk of catastrophic wildfire,” they wrote.
Indeed, in their Wildfire Mitigation Plan, PG&E reports that over half of their service territory lies in high risk areas, and that the wildfire threat has increased significantly due to 147 million trees killed by drought and invasive beetles from 2010-2018.
Altogether, they count 5,500 line-miles of electric transmission and 25,500 line-miles of distribution assets in these high-risk areas, about one-third of total lines — even though the lines serve only 10% of their customers. In 2021, PG&E announced their intention to underground 10,000 of those miles. PG&E undergrounded 73 miles in 2021 and 180 miles in 2023. With current costs of about $3 million per mile, the total cost could be $30 billion.
Arguably, wildfire prevention and climate action benefit all of society, and should be paid for accordingly. Since income taxes are paid more by the wealthy, and charges on utility bills are paid by everyone, funding social goods from the state general fund would be more progressive.
One recent bill that Ava supports, but has not yet passed, would create a new Climate Equity Trust Fund to cover costs for building electrification and bill payment assistance, with funds provided by the legislature and other sources. Wildfire safety would be another appropriate subject of funding. Shifting costs off of utility bills would be the surest way to reduce pressure on rates, and make the shift to a clean and equitable energy future easier.